

Multi-Cloud Cost Optimization Framework
WHY MULTI-CLOUD COST IS GENUINELY HARDER
Single-provider cost control is mostly an accounting problem. Multi-cloud is a translation problem first. Each provider prices, meters, and bills differently, so the same nominal workload produces spend that is hard to compare and harder to consolidate [S27][S30]. Storage tiers, data-transfer models, and managed-service billing differ enough that small architectural choices move costs in ways that are not visible in real time [S30]. The result is a jigsaw: spend scattered across regions, service categories, and teams, with no single dashboard that tells you who owns what [S30].
There is a second, subtler difficulty. Comparing providers on nominal price, vCPU count and memory, is misleading, because equivalent specifications deliver different real performance depending on the underlying hardware and resource-allocation policy [S59]. Useful comparison requires performance-normalized pricing: cost per unit of actual workload performance, not cost per advertised core [S59]. A workload that looks cheaper on one provider may be slower, and therefore more expensive per unit of work delivered.
This is why a framework matters. The complexity is structural, not incidental, and ad hoc cleanups do not touch the structure.
THE DECISION LOOP
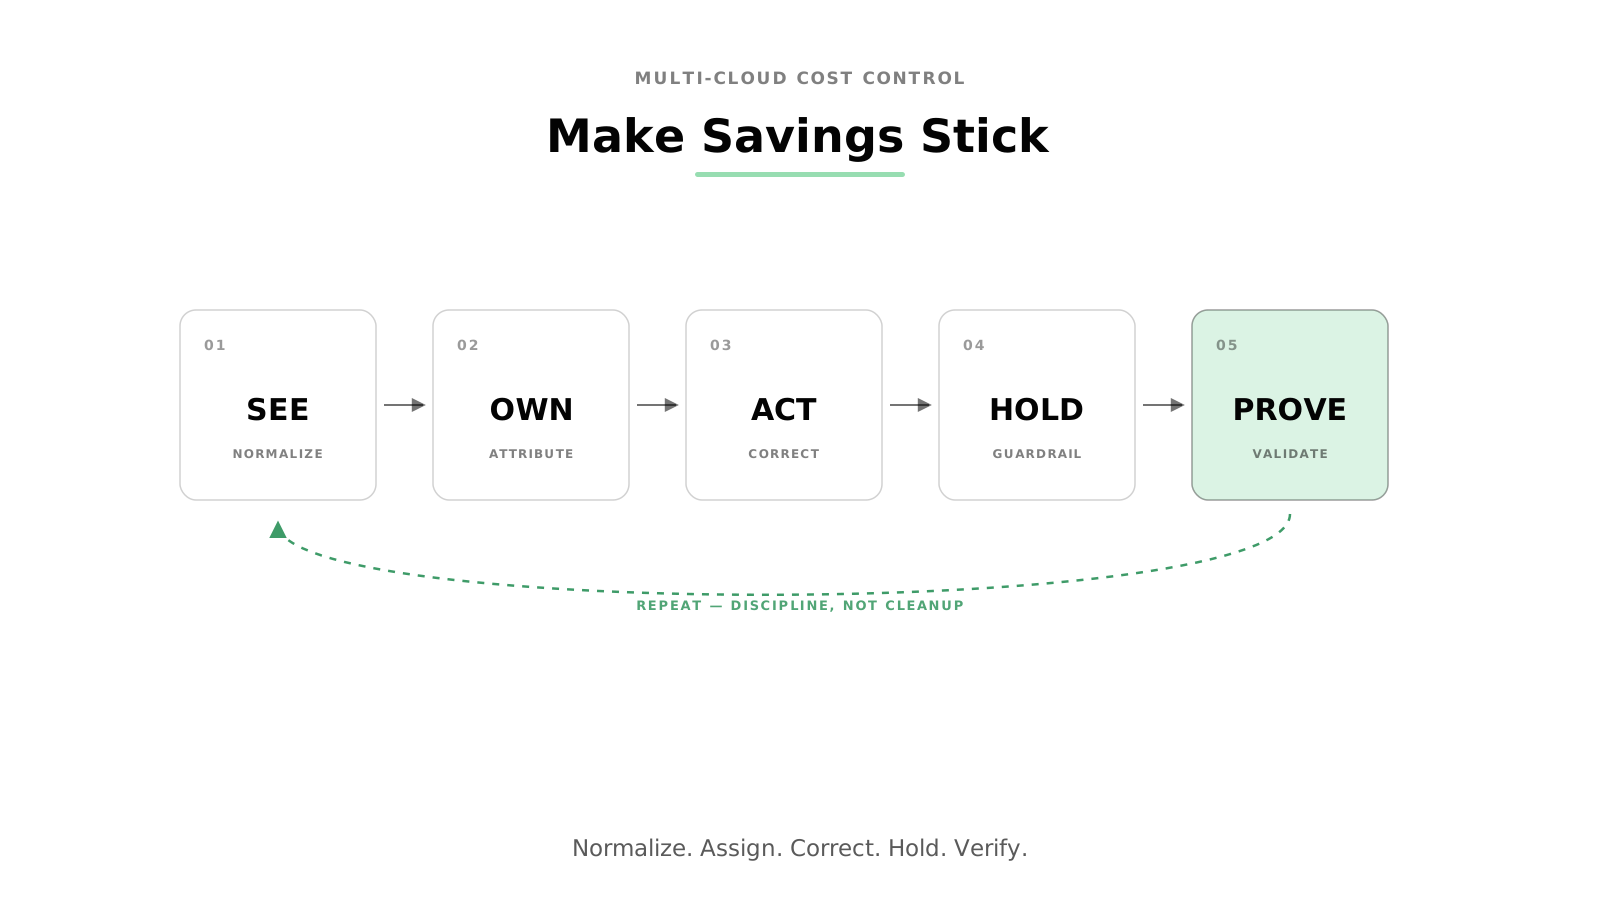
The loop has five steps. A useful framing in the literature describes it as a flywheel: observe, attribute, correct, guardrail, validate, run continuously rather than once [S12]. We keep the same shape and group it into five decisions.
1. Visibility: see the whole estate in one place
You cannot optimize what you cannot see consistently. The first step is unifying telemetry and billing across providers into a comparable view, including the costs that hide in the gaps, such as cross-provider data egress fees, which are significant and frequently undervalued [S59]. Visibility is not a dashboard for its own sake. It is the precondition for every later decision, and getting it right is mostly a data-integration problem: normalizing each provider's billing export into one schema.
2. Attribution: map spend to who incurred it
Once spend is visible, it has to be attributed. Attribution means mapping each unit of cost to a team, product, or business unit, usually through consistent tagging and a chargeback or showback model [S27][S30]. This is the step organizations most often under-invest in, and it is the one that makes the rest of the programme accountable. Where tagging is inconsistent or shared services (networking, caches, content platforms) are split incoherently, chargeback becomes error-prone and ownership of waste becomes ambiguous [S30]. Attribution is also a cultural act: it is the mechanism by which FinOps brings finance, engineering, and operations into the same conversation with shared accountability [S27].
3. Action: pull the right lever for the workload
Action is where the savings are realized, and it is where most public advice over-promises. There are three main lever families, each with a distinct trade-off. We cover them at framework level below.
4. Guardrails: stop the savings from eroding
Corrections decay. Non-production environments get left running again, instances get oversized again, storage accumulates again [S12]. Guardrails are the automated policy controls, budget thresholds, tagging enforcement, and anomaly alerts, that hold the gains in place and make suboptimal behavior costly by default [S12][S30]. The strongest programmes embed these into delivery pipelines and operational playbooks rather than treating optimization as a one-time initiative [S30].
5. Validation: prove it worked, then loop
The final step closes the loop: confirm that a correction produced the expected saving without degrading service, then feed the result back into the next round. This matters because cost optimization is full of trade-offs against quality of service. Cost-aware decisions that are not coordinated with scheduling and capacity planning can harm operational stability [S31]. Validation is the discipline that catches a "saving" that was actually a latency regression in disguise.
THE ACTION LEVERS, AND WHAT EACH ONE COSTS YOU
Rightsizing and autoscaling
Rightsizing matches provisioned capacity to real demand, removing the over-provisioning that is the largest and most common source of waste [S12][S30]. The most durable form is not a one-time resize but demand-based dynamic allocation: capacity that scales up and down with usage [S29]. The lever that powers this is forecasting. When short-horizon demand forecasting is wired directly into autoscaling and scheduling, reviewed studies report meaningful reductions in over-provisioning, with typical figures in the range of roughly 20 to 60 percent [S31] . The qualification is essential: that benefit holds only when forecasting feeds control mechanisms. Evaluated as an isolated model, the operational gains are unstable under changing workloads [S31].
The trade-off: aggressive rightsizing trades headroom for savings. Too tight, and you reintroduce SLO risk under bursts.
Commitments versus spot
Discounts come in two shapes with opposite risk profiles.
Commitments (reserved or committed-use pricing) give a discount in exchange for committing to a usage level over time. Across multiple providers this stops being a procurement task and becomes a portfolio problem: you are predicting future workload allocation and balancing the discount against demand uncertainty, much as you would weigh a financial instrument's risk and return [S59]. Over-commit and you pay for capacity you do not use; under-commit and you leave discounts on the table.
Spot or preemptible capacity sits at the other extreme: very large discounts, with one 2025 paper citing 60 to 90 percent against on-demand prices, in exchange for capacity that can be reclaimed at short notice [S59] . The discount is only real if the workload can absorb interruption through checkpointing, graceful degradation, or automated migration [S59]. Stateless, retry-tolerant, and batch workloads are good candidates. A customer-facing transactional system is not.
The trade-off here is risk tolerance, mapped to workload type. The decision is not "commitments or spot" in the abstract; it is which workload gets which treatment.
Workload placement
Placement decides which provider and region runs a workload, weighing performance-normalized price, egress cost, and constraints together rather than in isolation [S59]. It is the lever most entangled with architecture: data locality reduces egress fees, but replicating data for locality adds complexity and potential consistency issues [S59]. Placement is also where cost meets non-cost criteria, because the same decision touches latency, data residency, and resilience.
There is genuine upside here, and it is the one place the evidence is strongest. An Elsevier study modelling 23 IaaS providers found that well-chosen multi-cloud bundles can be measurably more efficient than equivalent single-provider services, with gains that varied by service category rather than being uniform [S20]. The honest reading is that multi-cloud can be more cost-efficient, but not automatically and not everywhere. Placement has to be earned with analysis, not assumed.
GOVERNANCE IS THE PART THAT LASTS
Underneath the levers sits governance, and it is what separates a programme from a project. The repeated finding across this literature is that schedulers and optimizers, including the reinforcement-learning and meta-heuristic approaches that report utilization gains of roughly 15 to 30 percent over static rules, deliver those gains only conditionally: they depend on forecast quality, on realistic modelling of multi-cloud constraints such as quotas and region limits, and on coordination with the rest of the control stack [S31] . In other words, a clever optimizer without good attribution and guardrails underneath it is fragile.
Practical governance for a CIO means three commitments. Make attribution non-optional, so that every resource has an owner. Encode guardrails as policy that runs automatically, not as a quarterly review. And keep cost decisions coordinated with performance and capacity planning, so that optimization does not quietly trade away stability [S31].
HOW TO MEASURE SUCCESS
Measure the loop, not the one-off win. Three signals matter more than a headline savings number:
- Coverage of attribution. What share of spend is mapped to an owner? Low coverage caps everything downstream [S27][S30].
- Waste trend, not waste level. Is over-provisioned and idle spend declining over successive cycles, or does it spring back between cleanups? A flywheel works when the trend bends [S12].
- Cost per unit of work, normalized for performance. Raw spend can fall while efficiency worsens. Tracking cost against delivered performance keeps the comparison honest across providers [S59].
A programme that improves on all three is optimizing. A programme that only reports a quarterly dollar saving is doing cleanups.
LIMITATIONS OF THE EVIDENCE
Be clear-eyed about what the published research does and does not show. Much of the quantitative evidence on AI-driven forecasting and scheduling comes from testbeds and simulators, with limited reproducibility and limited generalization to real multi-cloud production environments [S31]. The effect ranges cited above (20 to 60 percent over-provisioning reduction, 15 to 30 percent utilization improvement, 60 to 90 percent spot discount) are literature-reported and source-attributed, not guarantees, and several rest on single sources [S31][S59]. The strongest empirical claim here, that multi-cloud bundles can be more efficient, is itself scope-limited to one DEA study and a 2021 pricing snapshot [S20]. Treat the framework as durable and the numbers as directional.
PRACTICAL NEXT STEPS
- Map where your multi-cloud spend is attributed today. Measure the percentage with a clear owner before anything else.
- Unify billing and telemetry into one comparable view, and surface the hidden costs, egress in particular.
- Classify workloads by interruption tolerance so the commitments-versus-spot decision is made per workload, not per platform.
- Turn your best corrections into automated guardrails so they cannot quietly reverse.
- Define a small set of loop metrics (attribution coverage, waste trend, performance-normalized unit cost) and review them every cycle.
Multi-cloud cost optimization rewards the organizations that treat it as a standing discipline. The framework is simple to state and demanding to sustain, which is exactly why most of the value is in the sustaining.
For teams formalizing this, cost is rarely the only criterion in a workload decision. A control layer that gives visibility across cloud environments and supports evaluating cost alongside sovereignty, compliance, and operational trade-offs, with evidence recorded for later review, is where many regulated organizations are heading. That is the problem Atomity works on.
SOURCES
- [S20] Chatzithanasis, G., Filiopoulou, E., Michalakelis, C., Nikolaidou, M. (2021). *Exploring cost-efficient bundling in a multi-cloud environment.* Simulation Modelling Practice and Theory, Elsevier.
- [S59] Poka, V. (2025). *Multi-Cloud Optimization: Orchestrating Workloads Across Heterogeneous Cloud Environments.* Journal of Information Systems Engineering and Management.
- [S31] Loku Nikçi, L., Ibrahimi, A., Dermaku, A., Ahmedi, B. (2026). *AI-Driven Cloud Administration: A Literature Review and Comparative Synthesis of Forecasting, Resource Allocation, Cost Optimization and Load Balancing Approaches.* International Journal of Innovative Technology and Interdisciplinary Sciences.
- [S12] Kasireddy, J. R. (2025). *The Cloud Cost-Optimization Flywheel: A Systematic Approach to Reducing Infrastructure Waste Without Compromising Delivery Velocity.* IJAESIT.
- [S27] Kodi, D. (2025). *Multi-Cloud FinOps: AI-Driven Cost Allocation and Optimization Strategies.* ICCSAIML'25, Eureka Vision.
- [S30] Suryadevara, S. S. K. (2024). *Intelligent Cost Optimization System for Multi-Cloud Experience Platforms.* IJETCSIT.
- [S29] Mohammad, N. (2023). *Dynamic Resource Allocation Techniques for Optimizing Cost and Performance in Multi-Cloud Environments.* IJCC, IAEME.
/ GET STARTED
Make Sovereign Cloud Decisions with Confidence
Turn sovereignty requirements into enforceable cloud decisions, with continuous visibility and evidence across providers.