

Multi-Cloud Cost Attribution and Waste Detection
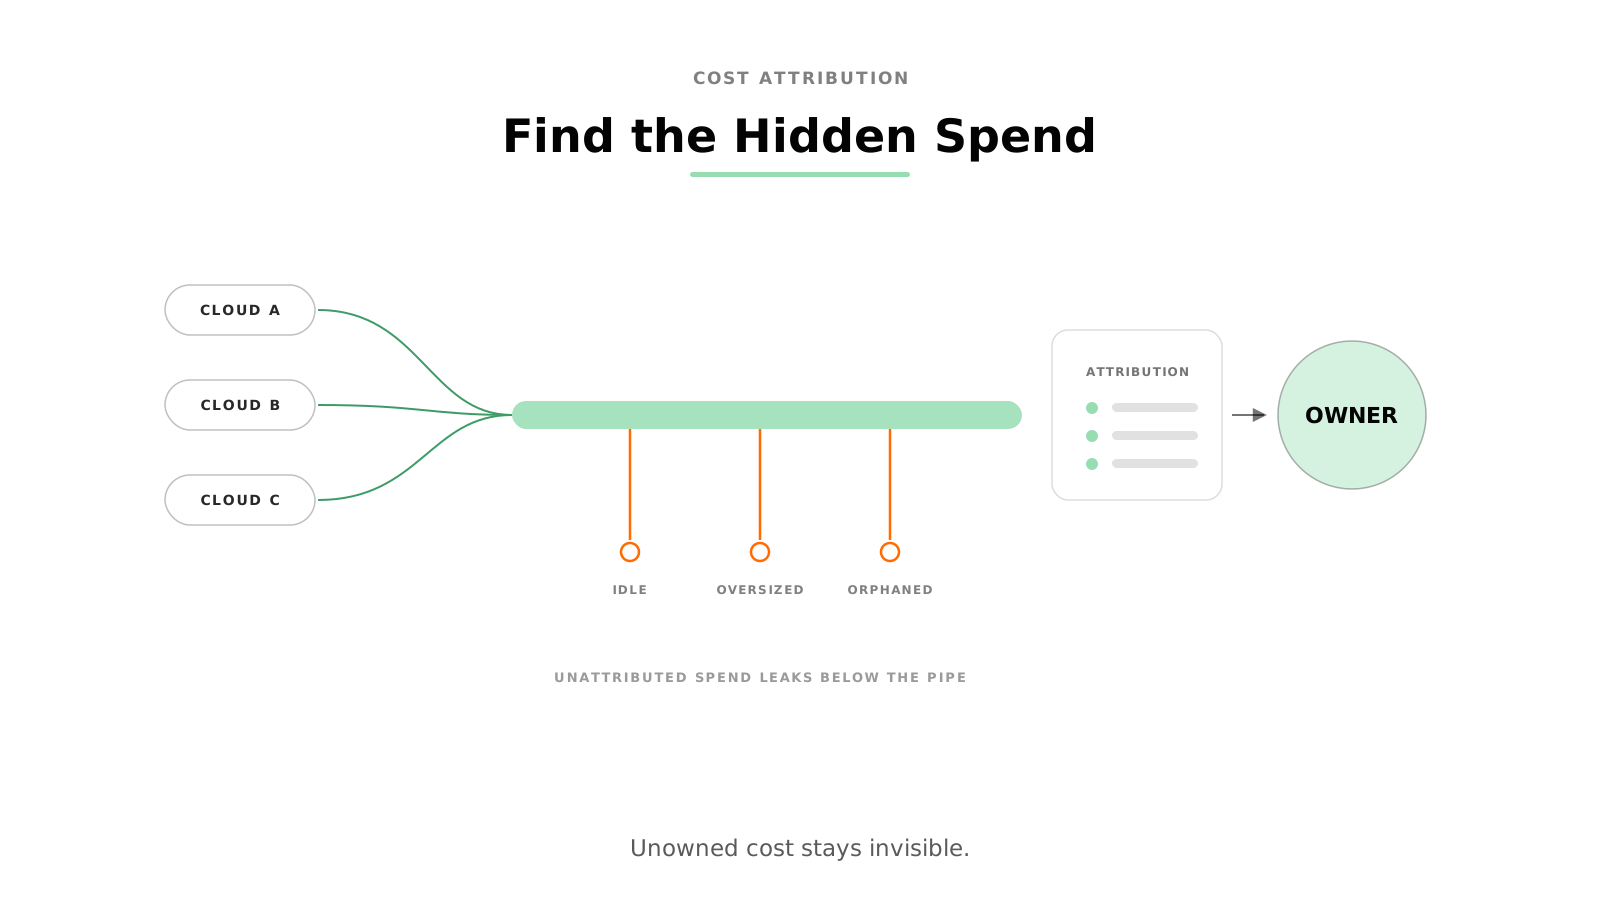
WHY MULTI-CLOUD SPEND HIDES
A single cloud bill is already hard to read. A multi-cloud bill is harder for a structural reason: each provider uses different pricing structures, billing formats, and metering logic, so there is no single consistent view of spend across environments [S30][S28]. A change in a storage tier or a data-transfer pattern can shift cost behaviour in ways that are not easy to monitor in real time, and reconciling SKUs, tags, and usage semantics across providers becomes a continuous task rather than a monthly one [S30][S28].
The result is fragmented billing. Finance, operations, and engineering often only understand spend after the fact, by reading billing reports, building spreadsheets, or glancing at provider-native dashboards [S30]. By the time an inefficiency or a spike shows up there, the money is already spent. Provider-native cost tools are useful, but each is strongest inside its own ecosystem and weaker across clouds [S30], which leaves the cross-cloud picture incomplete.
Industry surveys consistently report that a meaningful share of cloud spend is wasted and that most enterprises now run more than one cloud, which compounds the visibility problem. The mechanism matters more than any single figure: when spend is fragmented and unattributed, waste does not announce itself.
THE CATEGORIES OF WASTE
Waste is easier to address once it is named. Across the literature, a few categories recur [S12][S28].
Idle and underused resources. Resources that run but are barely used. The classic example is non-production environments left on after business hours, on weekends, and on holidays, even though development and testing only happen during the day [S12]. Idle IP addresses and lightly used clusters fall into the same group [S28].
Over-provisioned resources. Resources that are used, but oversized. Teams often provision for peak or worst-case demand, which means substantial excess capacity during normal operation [S12]. A database sized for an infrequent peak, or an instance family chosen for convenience rather than fit, both leak money quietly [S12].
Untagged resources. Resources with missing or inconsistent metadata. These are not wasteful in themselves, but they are unattributable, which makes every other control weaker. Without clean tags, it is easy to miss orphaned volumes, idle IPs, and zombie clusters entirely [S28].
Orphaned resources. Resources left running after their purpose ended. A virtual private network endpoint created for one project often stays up long after the project, the application, or the network topology that justified it has gone [S12]. These leftovers keep charging until someone audits them.
The pattern across all four is the same: the resource is detached from an accountable owner. That is the gap attribution closes.
ATTRIBUTING COST TO OWNERS
Attribution maps spending to the behaviour, team, or system that caused it. It is a distinct step from cost reporting, and a harder one, because surface-level cost figures often hide the real driver of consumption [S12]. Knowing that a bill rose is not the same as knowing why, or who can change it.
Attribution rests on tagging: labelling resources with metadata such as owner, environment, cost centre, and business purpose, so spend can be traced to a team or project [S12]. Tags are only as good as their consistency. When tagging is incoherent, or when business units share infrastructure such as networks, caches, or content platforms, attribution breaks down [S30]. This is why mandatory tagging standards, enforced at provisioning time, recur as a governance recommendation [S12].
With reliable tags in place, two reporting models become possible. The FinOps Foundation defines them precisely [W1]:
- Showback reports costs back to a team for visibility, without moving the charge onto that team's budget. It creates accountability through transparency.
- Chargeback assigns actual consumption spend to a business unit's profit-and-loss or budget, making that unit directly accountable for what it consumes.
Showback is the lighter-touch starting point; chargeback depends on an organisation's accounting policy [W1]. Both fail in the same way when tags are inconsistent, which is why attribution and tagging discipline have to come first [S30].
Attribution also enables unit economics: expressing spend as cost per user, per request, or per transaction [S12][S28]. This is the measure that tells you whether spend is healthy. Cloud cost is expected to rise as a business grows, but it should track business metrics such as revenue, transactions, or active users. When cost grows faster than those metrics, the divergence is a signal that something is leaking [S12]. Raw spend alone cannot tell you that; unit cost can.
CATCHING ANOMALIES EARLY
Attribution tells you who owns spend. Anomaly detection tells you when spend has gone wrong before the invoice arrives. A cost anomaly is a spending pattern that deviates significantly from an expected baseline, and it can signal waste, a misconfiguration, or a security event such as compromised credentials [S12][S28]. A misconfigured autoscaling rule that keeps nodes running, a batch job firing more often than intended, or a sudden traffic surge all show up as deviations from normal [S12].
There are two broad approaches, and they trade off differently.
Threshold-based detection uses predefined limits: alert when spend or utilisation crosses a fixed line. It is simple and transparent, but it is brittle. Fixed thresholds do not keep pace with workloads that change shape, and they tend to miss short-lived spikes or slow drifts between review cycles [S28].
Machine-learning detection, typically unsupervised, learns normal patterns and flags deviations without predefined thresholds. Methods cited across the literature include clustering, isolation forests, and autoencoders, which can establish dynamic baselines that adapt as usage evolves [S28][S14]. This adaptability is the main advantage over static thresholds [S14].
The harder problem in both approaches is sensitivity. Set detection too tightly and it floods teams with alerts, which dulls attention to the ones that matter. This is the alert-fatigue trade-off, and it is real. The countermeasure cited in the sources is context-aware detection that distinguishes a legitimate increase, such as a planned product launch, from a genuine anomaly, which reduces false positives [S28][S14]. A detector that cries wolf is quickly ignored, so calibration is as important as the algorithm.
It is fair to say that AI- and ML-augmented detection is reported to improve accuracy over threshold-only methods [S28][S14][S60]. It is not fair to attach a precise figure to that improvement. The reported numbers vary widely between studies, several come from controlled or simulated setups, and they depend heavily on data quality and model retraining [S60][S28]. Treat the direction as established and the magnitude as situational.
FROM ONE-OFF CLEANUP TO AN OPERATING LOOP
Finding waste once is a project. Keeping it found is a discipline. The most useful framing in the source material is a repeatable loop [S12]:
- Observe. Detect unexpected cost and identify which services are responsible, separating normal operational cost from waste [S12].
- Attribute. Trace the spend to the behaviour, team, or configuration that caused it [S12].
- Correct. Fix the root cause rather than the symptom, so the cost does not reappear elsewhere [S12].
- Guardrail. Automate the correction through policy, because human vigilance fades as teams rotate and priorities shift [S12].
- Validate. Measure the outcome across cost, performance, and reliability, not cost alone [S12].
- Repeat. Run the loop continuously so improvements compound instead of decaying [S12].
The point of the loop is durability. A single cleanup recovers spend once; a loop with automated guardrails prevents the same waste from returning after the people who fixed it have moved on [S12]. Embedding these checks into existing engineering workflows, rather than running them as periodic audits, is what makes cost control stick [S30][S28].
LIMITATIONS
These practices are necessary, not magical, and they have honest limits.
Attribution depends on tagging that is correct and complete, which remains difficult in multi-team, multi-cloud estates; incomplete or inconsistent tags reduce visibility into the real cost drivers [S30]. Anomaly detection depends on clean, fresh data: noisy, sparse, or stale metrics degrade forecasts and weaken detection [S60]. Machine-learning models also drift as workloads change, so they need continuous monitoring and retraining to stay accurate [S60][S28]. And providers are not interchangeable: pricing rules, resource semantics, and platform-specific behaviour differ enough that an approach tuned on one cloud may not transfer cleanly to another [S60][S28]. None of this argues against attribution or detection. It argues for treating both as ongoing operational commitments rather than one-time installations.
WHERE A CONTROL LAYER FITS
Most of the difficulty in this article comes back to a single root cause: spend, waste, and anomalies are scattered across environments that do not share a common view. Closing that gap calls for visibility across multiple cloud environments and for anomaly detection that works above any single provider's tooling.
This is the layer Atomity is built to support. Atomity helps regulated enterprises and public-sector organisations make, enforce, monitor, and prove cloud workload decisions across sovereign, hybrid, and multi-cloud environments. In the cost context specifically, that means providing visibility across multiple cloud environments and supporting anomaly detection, so cost signals can be seen and reviewed in one place rather than reconstructed from fragmented bills after the fact. The aim is not to replace attribution discipline but to give it a consistent, single point of view.
CONCLUSION
Multi-cloud spend leaks in predictable places: idle and over-provisioned resources, untagged and orphaned resources, and bills fragmented across providers. The leaks stay invisible because spend is detached from an owner. Attribution reconnects it, through consistent tagging and showback or chargeback, and unit economics tell you whether spend is tracking the business. Anomaly detection then catches deviations early, provided the alerting is calibrated to avoid fatigue. Run as a continuous loop rather than a one-off cleanup, these practices turn cost from a monthly surprise into something a team can see, attribute, and review.
CTA
If your cloud spend is hard to trace across providers, start with the unglamorous work: a tagging standard, a showback report your teams will actually read, and an anomaly baseline you trust enough to act on. To see how a control layer can give attribution and anomaly detection a single cross-cloud view, explore how Atomity supports cloud cost visibility and review.
SOURCES
- [S12] Kasireddy, "The Cloud Cost-Optimization Flywheel," IJAESIT, 2025. Observe/attribute/correct/guardrail loop; waste categories; attribution and tagging. (Tier C.)
- [S14] Chennupati, "AI for Cloud Economics," IJSAT, 2025. Unsupervised anomaly detection versus thresholds; alerting sensitivity. (Tier C.)
- [S28] Rusum and Anasuri, "AI-Augmented Cloud Cost Optimization," IJAIDSML, 2024. Anomaly detection methods; dynamic allocation and showback/chargeback; waste signals. (Tier C.)
- [S30] Suryadevara, "Intelligent Cost Optimization System for Multi-Cloud Experience Platforms," IJETCSIT, 2024. Fragmented billing; unified visibility; tagging and attribution breakdown. (Tier C.)
- [S54] Halli and Olaoye, "The Impact of AI on Cloud Cost Optimization and Resource Management," SSRN, 2025. General mechanism categories. (Tier C preprint; case-study figures excluded.)
- [S60] "Intelligent FinOps Architectures," SSRN, 2025. Budgeting accuracy; data-quality and vendor-variance limitations. (Tier C preprint; simulation results not used as fact.)
- [W1] FinOps Foundation, Framework: Allocation, Showback, and Chargeback capabilities. Retrieved 2026-06-15. https://www.finops.org/framework/capabilities/allocation/
---
DRAFT NOTES, NOT FOR PUBLICATION
- unresolved claims: none in body. Former C11 (third-party waste/adoption figures) was removed from the draft and replaced with a non-attributed, qualitative statement to keep the article competitor-neutral and free of unverified numbers.
- legal review needed: none (no regulatory claims).
- product approval needed: Atomity mention uses only approved capability vocabulary ("anomaly detection," "visibility across multiple cloud environments") and the approved description line; no GA/integration/quantified claim.
- images: see SEO block below.
- internal links: see SEO block below.
- external citations: W1 FinOps Foundation only.
/ GET STARTED
Make Sovereign Cloud Decisions with Confidence
Turn sovereignty requirements into enforceable cloud decisions, with continuous visibility and evidence across providers.