

Forecasting Cloud Costs with Machine Learning
WHAT THE STUDIES ACTUALLY DO: THE METHODS
Cloud cost forecasting research clusters around two families of method, and it helps to define them plainly.
Time-series forecasting treats spend as a sequence of values over time and projects it forward using the structure in the history itself, such as trend, seasonality, and recent momentum. Classical statistical models like ARIMA (Autoregressive Integrated Moving Average) sit here, as do specialised tools such as Prophet, which is designed for series with seasonal variation and gaps [S39][S14]. So do newer pretrained transformer models such as TimeGPT, which forecast a series without being trained from scratch on it [S39].
Regression and machine-learning models learn a function from features to a target value, and can incorporate signals beyond the cost history, including usage metrics and contextual variables. The research surveys supervised regressors and recurrent neural networks such as LSTM (Long Short-Term Memory) and GRU (Gated Recurrent Unit), which are designed to capture longer dependencies in sequential data [S14][S04].
The applied work is concrete about how these are built and judged. In the most directly relevant study, a 2025 University of Vaasa MSc thesis built a FinOps cost-monitoring report and forecast Azure spend using two models, Prophet and TimeGPT, evaluating them with standard error metrics: MAE (Mean Absolute Error), RMSE (Root Mean Squared Error), and MAPE (Mean Absolute Percentage Error) [S39]. It held out the final 30 days of roughly 491 days of daily data for testing, a basic form of backtesting, which means checking a model against historical data it did not see during training [S39]. This is the right shape for an honest evaluation, and it is worth holding up as a reference point.
WHAT THE RESEARCH DEMONSTRATES
Two things come through consistently.
First, on a single, well-instrumented account, simple models can forecast spend with usable accuracy. In the Vaasa study, the best model was Prophet with default parameters, reporting MAPE of 20.86 percent, MAE of 5.10, and RMSE of 6.14 on the held-out period [S39]. The author positions a MAPE in the 20 to 25 percent range as acceptable for volatile, non-specialist time-series forecasting, while noting that more advanced forecasters can reach roughly 10 percent variance on cleaner problems [S39]. Notably, the heavily pretrained transformer model did not win: TimeGPT improved only up to five fine-tuning steps and then degraded into overfitting, and Prophet out of the box beat every TimeGPT variant [S39]. The practical lesson is that model sophistication did not buy accuracy here; data and fit did.
Second, across the broader literature, short-horizon forecasting earns its place by reducing over-provisioning and enabling proactive scaling rather than reactive firefighting. A 2026 literature review synthesising 57 studies concludes that short-horizon forecasting models "generally reduced over-provisioning and supported proactive scaling" [S31]. Tier-C surveys echo the mechanism and add specific figures, for example claims that time-series methods identify usage patterns with up to 85 percent accuracy for predictable workloads and that LSTM models reduce prediction error by 18 to 25 percent against traditional statistical baselines [S14]. Those numbers come from a low-tier source and are not independently corroborated here; treat them as illustrative of the claimed direction, not as established fact [S14].
There is also a methodological high-water mark worth naming, because it shows what rigorous cost-and-performance prediction looks like. A 2024 ETH Zurich PhD thesis on multi-cloud configuration for ML workloads predicts performance for an *unseen* workload and then recommends the most cost-effective configuration, validating its predictor with a leave-one-out cross-validation procedure and reporting error as MAPE chosen specifically because it scales to values that vary widely [S33]. The relevant detail for a forecasting reader is the discipline: the model is tested on workloads it never saw, not on a held-out slice of the same workload, which is a far harder and more honest test of generalisation [S33].
WHERE THE EVIDENCE IS FRAGILE
This is the part vendor material tends to skip, and it is where a FinOps team should concentrate its scepticism. Four fault lines recur.
Data quality and quantity. Forecasts inherit the weaknesses of their inputs. The Vaasa study is explicit that its roughly 491 days was a small training set, that early usage was not comparable to usage 18 months later because consumption had grown substantially, and that more data would likely improve accuracy [S39]. It also stresses that the FinOps Inform phase, getting tagging and clean cost data in place from the start, was a precondition for the forecast to mean anything; tags do not backfill in Azure, so late instrumentation leaves permanent gaps [S39]. Tier-C surveys report that a majority of organisations struggle to collect and prepare the historical data these models need [S14]. No model compensates for thin or dirty history.
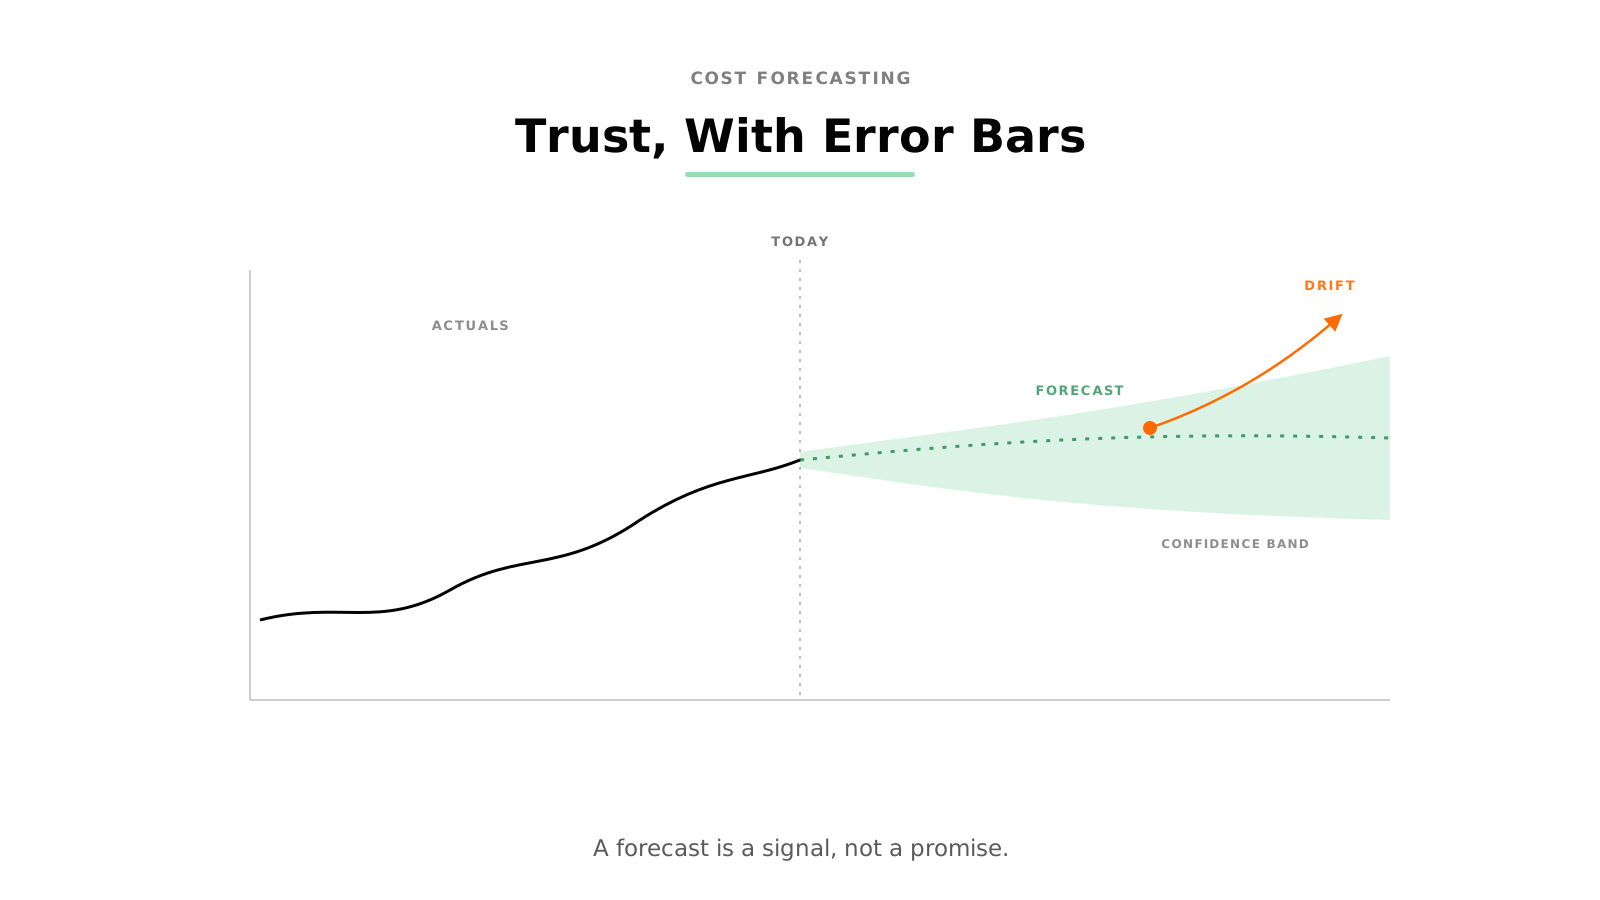
Model drift. *Model drift* is the decay of a model's accuracy as the world moves away from the data it learned on. Cloud spend is a moving target: pricing changes, workloads migrate, a product launches. The literature review flags directly that forecasting accuracy "may degrade under concept drift, promotional shocks, or cross-provider variability" and that drift-aware updates and retraining are increasingly treated as necessary to keep forecasts honest in production [S31]. A forecast is not a one-time artefact; it is a model that must be maintained.
Generalisation across providers and workloads. *Generalisation* is whether a model trained in one setting still works in another. Here the research is most cautionary. The Vaasa author states plainly that the results "are not for generalization" and that each new organisation must train and validate its own models, because usage is specific to the account [S39]. The review adds that supervised allocation and forecasting formulations "often rely on simplified assumptions that may not generalize under multi-cloud constraints" such as quotas, heterogeneous pricing, and provider-specific behaviour [S31]. A figure that holds for one Azure tenant should not be assumed to hold for a different estate, let alone across AWS, Azure, and Google Cloud.
Evaluation and backtesting gaps, and uneven rigor. The studies vary widely in how carefully they test their own claims. The N=57 review is blunt that much of the field is evaluated "in isolation," on simulators or limited scenarios rather than production, "with non-standardized metrics and varying levels of transparency and reproducibility," which makes cross-study comparison hard and headline accuracy figures difficult to trust at face value [S31]. Several primary studies do their evaluation in simulated multi-cloud environments rather than live estates [S07]. Set the disciplined held-out test of the Vaasa thesis [S39] and the cross-validation of the ETH work [S33] against the unsourced percentage claims common in lower-tier surveys [S14], and the spread in rigor is the most important finding of all.
WHAT THIS MEANS FOR A FINOPS TEAM
Atomity's reading, distinct from any single study's conclusion, is that the research supports a measured posture rather than either enthusiasm or dismissal.
A forecast is a decision input, not a decision. The defensible claims are local and short-horizon: on your own clean, well-tagged history, a simple model can give a usefully accurate near-term projection that beats reacting to last month's invoice [S39][S31]. The claims to distrust are the portable and absolute ones: a single accuracy percentage presented as a property of "ML forecasting" in general, with no statement of the data, horizon, provider, or evaluation method behind it.
Practically, a forecast deserves trust roughly in proportion to how well its owner can answer five questions. How much clean history trained it, and how well is the estate tagged [S39]? What horizon is it valid for, given that short-horizon forecasts are where the evidence is strongest [S31]? How recently was it retrained against drift [S31]? Was it validated on data it had not seen, ideally beyond a single workload [S33][S39]? And is the reported accuracy from this estate, or borrowed from a study of a different one [S39]? A model that scores well on those questions can carry real weight in budgeting and provisioning. One that cannot should inform, not decide.
LIMITATIONS OF THIS SYNTHESIS
This commentary is bounded by its corpus. The directly applied evidence rests heavily on one MSc thesis with a single case organisation and a modest dataset [S39], and the strongest methodological anchor is a configuration-and-performance study rather than a pure cost-forecasting study [S33]. Several supporting sources are Tier-C journals whose quantified accuracy figures we could not independently corroborate and have flagged accordingly [S14][S04][S57][S07]. We have deliberately weighted methodological limits over headline accuracy numbers, which means this piece is more conservative than the corpus average. None of the figures here should be read as a benchmark for your own environment.
PRACTICAL NEXT STEPS
- Audit your cost data before your model: tagging coverage and history length cap everything downstream [S39].
- Forecast short horizons first, where the evidence is strongest, and extend only as accuracy holds up on held-out data [S31][S39].
- Validate on unseen periods, and across workloads where you can, not on the data the model trained on [S33][S39].
- Schedule retraining and watch for drift after pricing changes, migrations, and launches [S31].
- Treat any vendor accuracy figure as a question to ask, not a number to adopt: on what data, what horizon, what provider, evaluated how [S31][S14].
Forecasting is most useful when it feeds a wider decision loop rather than standing alone. A cost projection becomes actionable when it sits alongside visibility across cloud environments and is weighed against sovereignty, compliance, and operational criteria, with the basis for each decision recorded for later review. That continuous-optimization context is the problem Atomity works on.
SOURCES
- [S39] Korhonen, J. (2025). *Predicting Cloud Service Costs with Machine Learning: Design a Report in Power BI and Forecasting Model Using FinOps Inform Phase Principles.* University of Vaasa, MSc thesis.
- [S31] Loku Nikçi, L., Ibrahimi, A., Dermaku, A., Ahmedi, B. (2026). *AI-Driven Cloud Administration: A Literature Review and Comparative Synthesis of Forecasting, Resource Allocation, Cost Optimization and Load Balancing Approaches (N=57).* International Journal of Innovative Technology and Interdisciplinary Sciences.
- [S33] Lazuka, M. (2024). *Automated and Efficient Multi-Cloud Configuration for Machine Learning Workloads.* ETH Zurich, Doctoral thesis.
- [S14] Chennupati, S. (2025). *AI for Cloud Economics: Predictive Models for Cost-Efficient Resource Allocation.* International Journal on Science and Technology (IJSAT).
- [S57] Guntupalli, R. (2025). *Predictive Cloud Resource Management: ML Models for Workload Demand, Spot Interruptions, and Cost Forecasting.* World Journal of Advanced Research and Reviews (WJARR).
- [S04] Rehan, W. (2025). *Optimizing Cloud Computing with AI: Improving Resource Allocation and Reducing Costs.* Contemporary Journal of Social Science Review.
- [S07] Bhattacharya, S. V. (2025). *Cost-Aware Multi-Cloud Resource Allocation using Predictive Analytics.* International Journal of Engineering & Extended Technologies Research (IJEETR).
/ GET STARTED
Make Sovereign Cloud Decisions with Confidence
Turn sovereignty requirements into enforceable cloud decisions, with continuous visibility and evidence across providers.